Every BI migration stalls at the same place. Not the platform decision, not the licensing — the inventory. Four hundred reports, most of them unused, none of them documented, and no way to know which matter without opening each one.
The estate is the work. And the estate is the reason migrations run for two years and are quietly abandoned in the eighteenth month.
What makes it slow
Rebuilding one Power BI page by hand means: opening it, reading each visual, working out which measure sits behind each title, finding the equivalent columns in the warehouse, writing the query, matching the layout, then checking the numbers against the original. Call it half a day for a simple page, two days for a real one. Multiply by the estate.
Most of that time is not skilled work. It is transcription.
What the agent does
You upload a screenshot. Two stages follow, and the split between them is the important part.
Read the page
One vision pass reports what is visible: how many visuals, their kind, their titles, their axis and legend labels, roughly where they sit, and the slicers.
Write the queries
One sub-agent per panel, in parallel, each given that panel's brief plus your warehouse schema. Each writes one SQL statement.
Prove each one runs
Every query is validated and executed once. A statement that will not run does not become a panel.
Assemble and report
The panels become a draft dashboard, and every one is marked matched, drafted, or needs a look — with the reason.
sequenceDiagram
    autonumber
    participant U as Analyst
    participant C as InsightCompose
    participant V as Vision model
    participant S as Sub-agents
    participant W as Warehouse

    U->>C: Upload a Power BI screenshot
    C->>V: What visuals are on this page?
    V-->>C: 12 visuals, kinds, titles, labels, slicers
    C->>C: Map boxes onto a 12-column grid
    par One sub-agent per panel
        C->>S: Panel brief + warehouse schema
        S-->>C: SQL + chart spec, or "cannot"
        C->>W: Run it once to prove it works
        W-->>C: Columns and a sample row
    end
    C->>C: Publish each query, assemble a draft dashboard
    C-->>U: Live dashboard + fidelity report
The discipline that makes it trustworthy
An agent that rebuilds a dashboard can fail in two ways. It can fail to produce a panel — visible, annoying, harmless. Or it can produce a panel that looks right and is wrong. The second failure is the one that matters, because nobody catches it.
So the system is arranged to fail the first way.
A screenshot is evidence of a layout, not of a schema
The vision pass is asked only for what is printed on the image. It is explicitly told not to infer a measure definition, an aggregation, a time grain or a date range that is not written down. If a title says "Net Margin", it reports "Net Margin" — it does not decide whether that means gross profit over revenue or contribution after allocated cost.
| A screenshot gives you | It does not give you |
|---|---|
| Visual count, reading order, relative size | The measure behind a title |
| Chart kind and orientation | The aggregation and time grain — YTD, rolling 12, snapshot |
| Titles, axis and legend labels | Whether a slicer scopes the page or cross-filters one visual |
| The filter chrome and its selected values | Sort, top-N, and whether empty members are shown |
| The direction of a conditional format | Drill-through targets, bookmarks and tooltip pages |
Nothing is substituted to fill a gap
If the warehouse has no column that answers a panel, the sub-agent says so and the panel becomes a note on the layout explaining what is missing. It is not dropped — a dropped panel is invisible, and somebody comparing against the original would have to notice its absence. It is not approximated with a different column either.
What it deliberately will not attempt
Maps, decomposition trees, key influencers, smart narratives, R and Python visuals and custom visuals are reported as themselves and left for a person. A map silently redrawn as a bar chart is a wrong panel that nobody notices.
Power BI's vocabulary, not an approximation of it
The reader works in the terms the source tool uses, because a rebuild that cannot say "doughnut" has to guess. Clustered and stacked columns and bars, 100% stacked variants, line, area and stacked area, line-and-clustered-column combos, pie, doughnut, treemap, scatter, bubble, funnel, waterfall, gauge, KPI, card, table and matrix are all rendered natively — and a ribbon chart is reported as a stacked column rather than as "other".
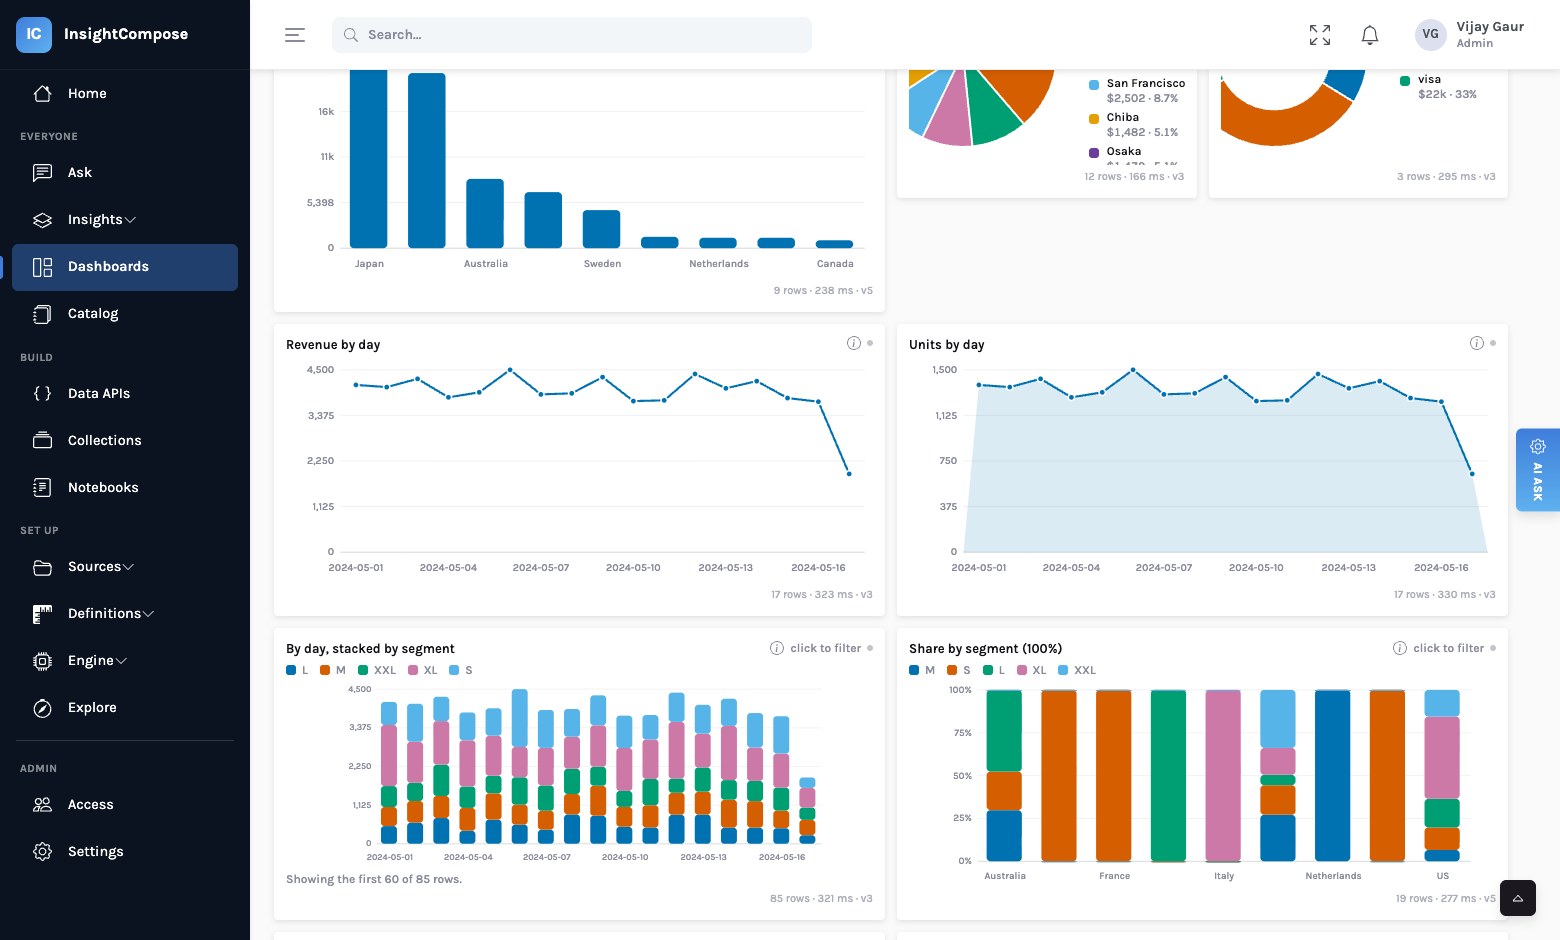
What you get back
Three things, and the third is the one that saves the project.
A dashboard. A draft, laid out in the reading order of the original, showing live data. It is an ordinary dashboard — editable, publishable, versioned. There is no special "imported" kind of panel.
A set of data APIs. Every query the agent wrote is saved as a named query with declared parameters and a published response shape. Each one is callable on its own, from anything. The dashboard is simply their first consumer.
A fidelity report. Per panel: matched (SQL written and it ran),
drafted (it ran but returned nothing, so the columns are a guess) or
needs input with the reason in words — "this schema has no column for
allocated overhead". That report is the migration plan.
The queries are published; the dashboard is not
A panel cannot show live data until its query is published, and seeing the numbers is the point. But the dashboard itself stays a draft, so nothing reaches a consumer until a person has read the report and published it. Meanwhile the queries are reachable by signed-in users and by nothing else — an API key needs an explicit grant, and a new key has none.
Ask for the file before you ask for the screenshot
This is worth saying plainly, because it can remove most of the guesswork.
A .pbix is a zip whose Report/Layout entry is JSON holding every
visual's type, position and field bindings. Power BI Desktop's Performance Analyzer exports
the actual DAX each visual runs. Either one is a few clicks for whoever owns the report, and
either one removes the inference entirely.
The screenshot pipeline is the fallback for when neither is forthcoming — which, in a large organisation with a report nobody owns any more, is often.
What this does to the migration plan
It does not make a four-hundred-report estate disappear. It changes what the work is.
An analyst spends most of a day reading a page and rebuilding it, then a short while deciding whether the numbers are right.
The draft arrives in minutes with its own report of what it could not work out. The analyst spends their time on the part that needed a person.
And the estate becomes legible as a side effect. A report that rebuilds cleanly was straightforward. A report whose every panel comes back needing input is telling you something true about its dependence on logic that lives in the report rather than in the warehouse — which is exactly the report you did not want to discover in month eighteen.
Read next
One number, one definition — how AI-written SQL is governed so it can sit under a regulatory filing.