- contact@insightcompose.com
InsightCompose · AI insights platform
Insights from your data. Verified once, served everywhere.
An agent reads your warehouse and proposes the questions worth asking. You build on them, every figure in the story is checked against the rows it came from, and what you publish — an insight, a dashboard, a data API — is a versioned endpoint in one governed catalog. Inside your own environment, with your own LLM.
- Your cloud or on-prem
- Bring your own LLM
- A ledger of every call
Built by VerticalServe — a decade of data, ML and AI delivery for Fortune 500 enterprises in finance, healthcare, retail, telecom, energy and the public sector. Part of the InsightLake suite.
How it works
From a connected warehouse to a governed catalog — in four steps
Connect and index once. Discover, build, publish and govern from then on.
Step 1
Connect and index
Point InsightCompose at the warehouse you already run — table by table, several schemas as one source. It profiles the tables, learns the joins, aligns your glossary and agreed metrics, and suggests conventions from your dbt project and the queries your analysts already run. Nothing is copied out.
Step 2
Discover and ask
The discovery agent proposes the questions your data can answer, by theme. Steer it with a brief, or ask anything in plain language — the engine finds the client or broker you named, even misspelt, applies your definitions, writes the SQL and shows its work.
Step 3
Build and verify
Build on a proposal, describe it in a sentence, drag fields in the query and chart builders, or bring the SQL you already have. Every run is checked against the rows, and nothing that does not trace is published quietly.
Step 4
Publish and govern
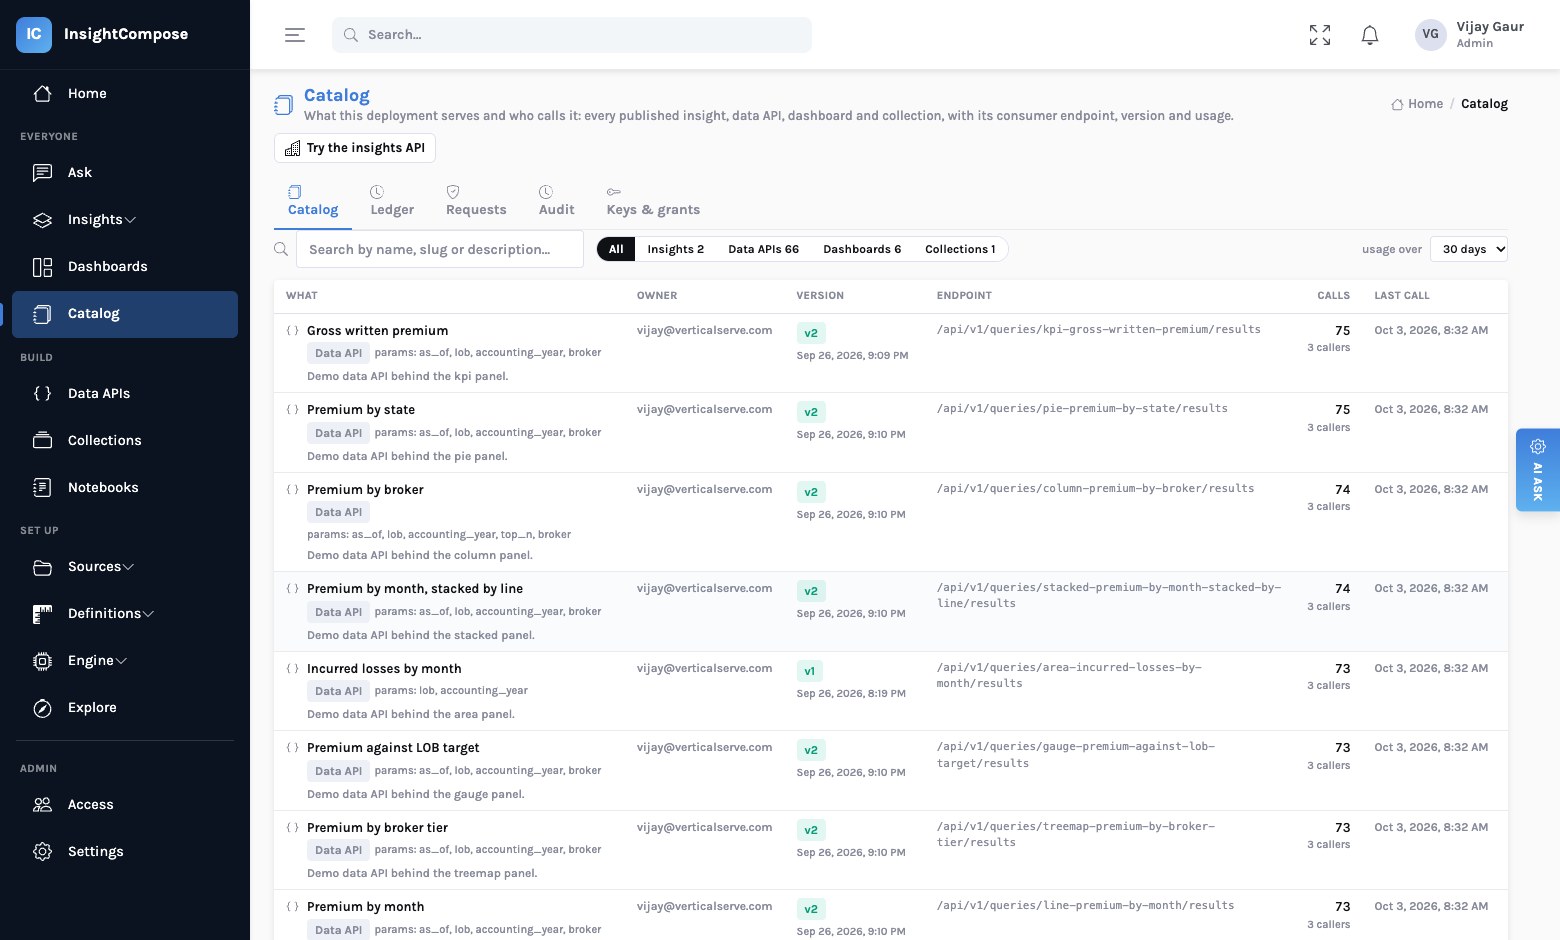
Insights, dashboards, data APIs and collections publish as versioned endpoints into one catalog — with approvals, grants per key or directory group, column masking, quotas and a ledger of every call.
Why it is different
Insight as an address, not a destination
Every BI tool locks its numbers behind its own screen. That was fine when the only consumer was a person reading a report. It stops working the moment the next consumer is an application, a partner portal or an AI agent.
InsightCompose makes the number itself the product. A question becomes a data API with declared, typed filters and a pinned response shape. A dashboard is just one consumer of it.
- Insights. A verified narrative with its figures, chart, recommended actions and grounding — served at
/v1/insights/<slug>/resultsfor any scope a caller is entitled to. - Data APIs. No model runs when an endpoint is called — values are bound, the statement is validated, the warehouse answers.
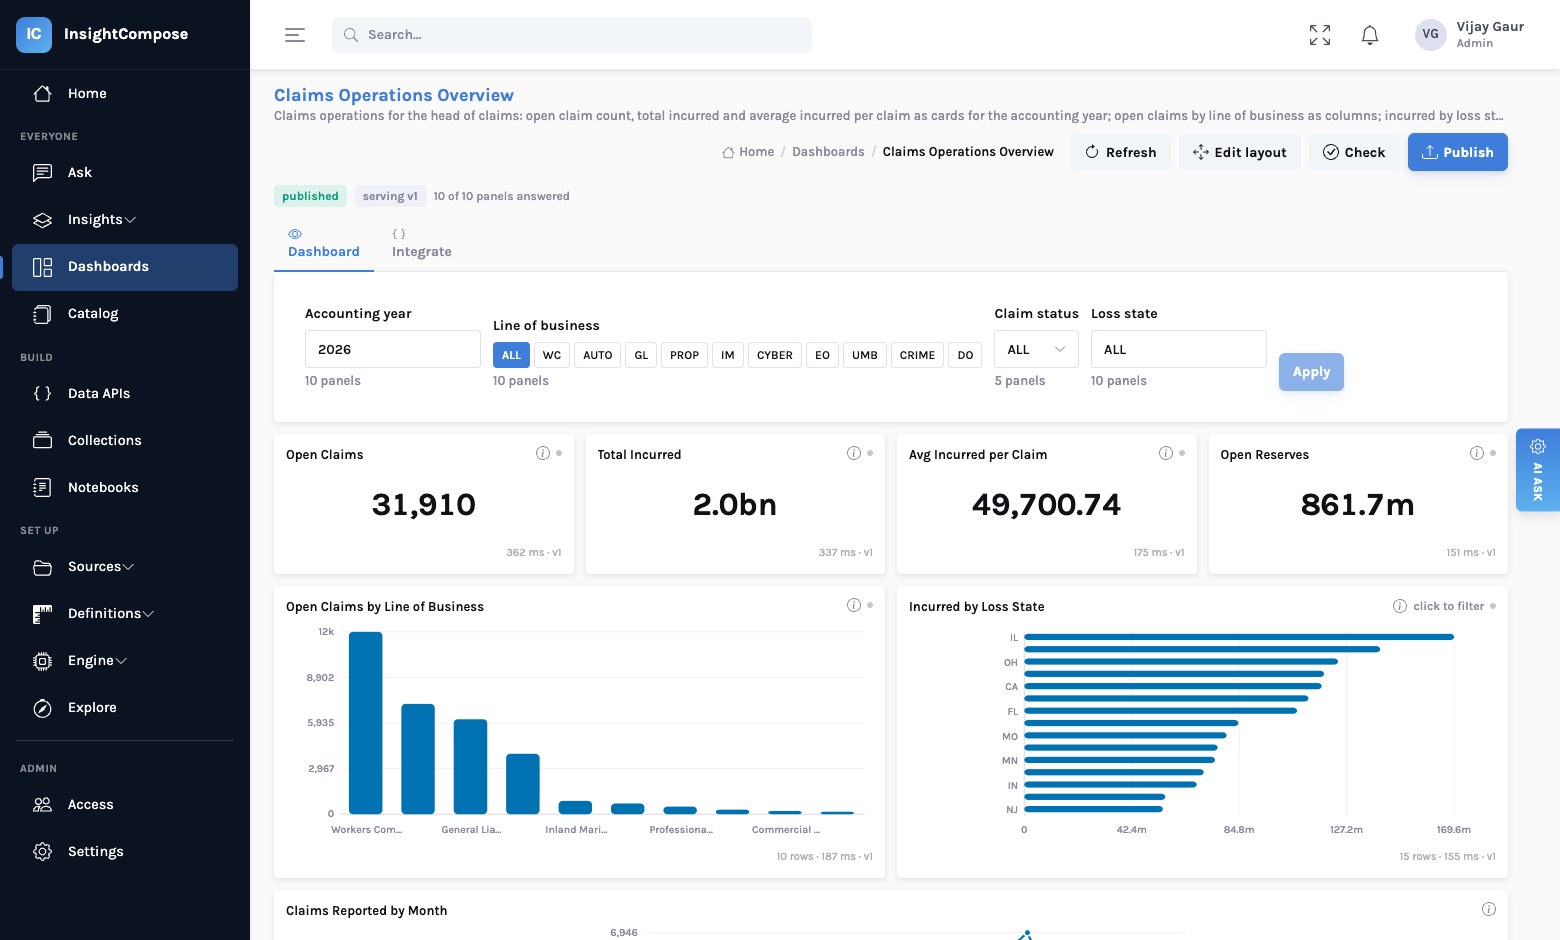
- Live dashboards. Described in a sentence or rebuilt from a Power BI screenshot; layouts over those APIs, querying your warehouse directly. A panel can be an insight.
- Collections. An ordered, versioned set of insights a host application pulls in one call — a Monday pack, a broker review, a board page.
Insights
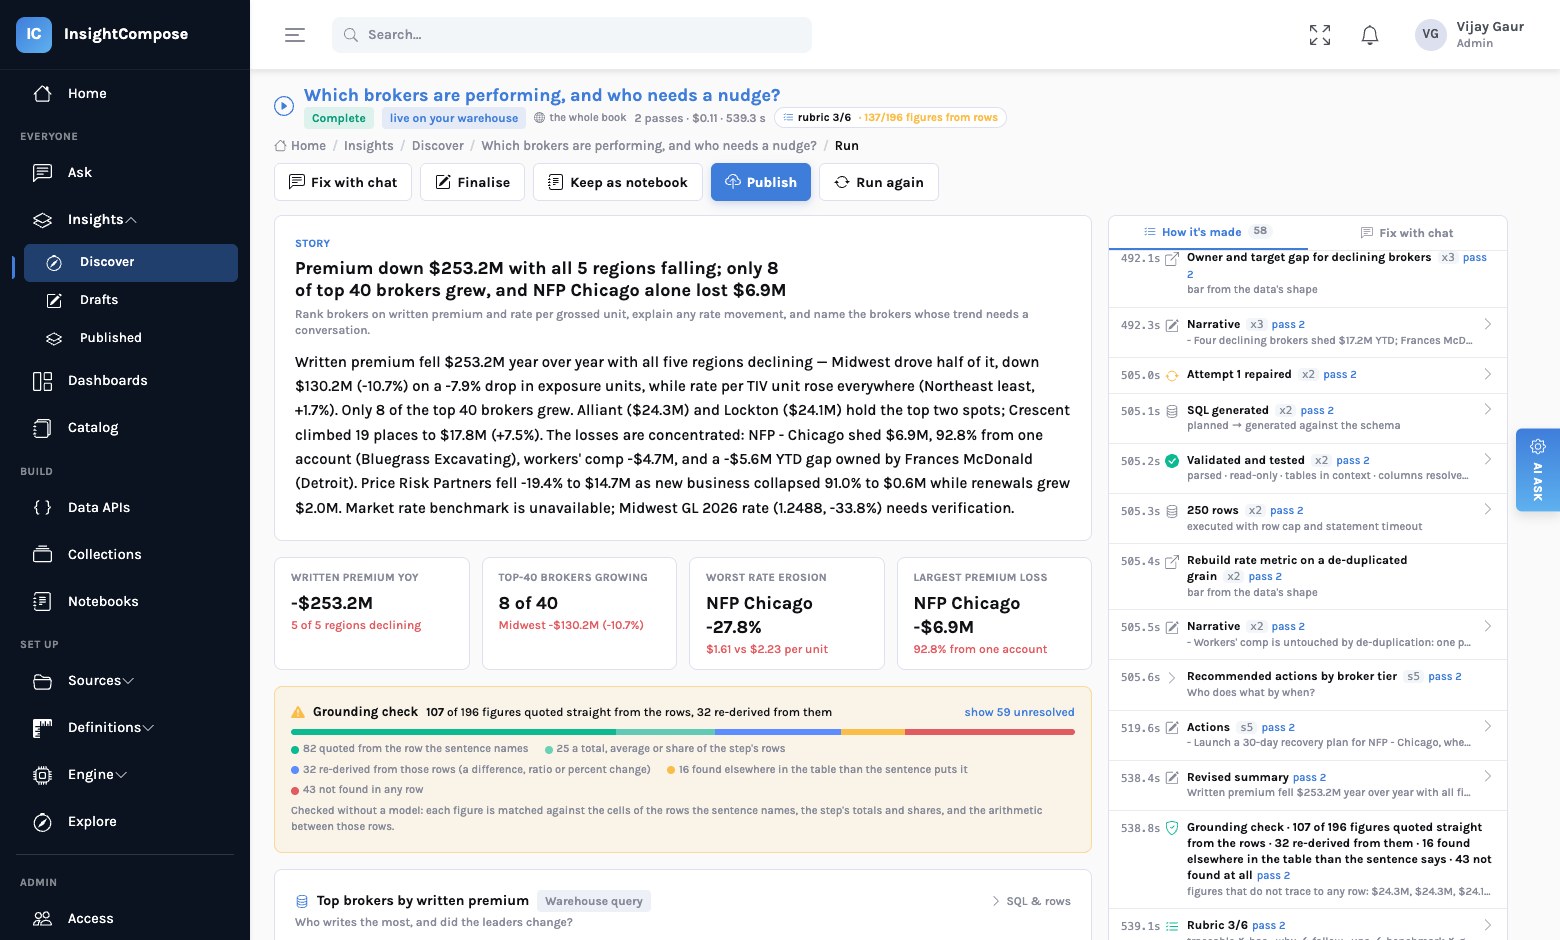
An insight that shows its work
Most AI analytics stops at a chart. An InsightCompose insight is the whole answer: what the data says, why it matters, what to do about it — and the evidence for every figure in it.
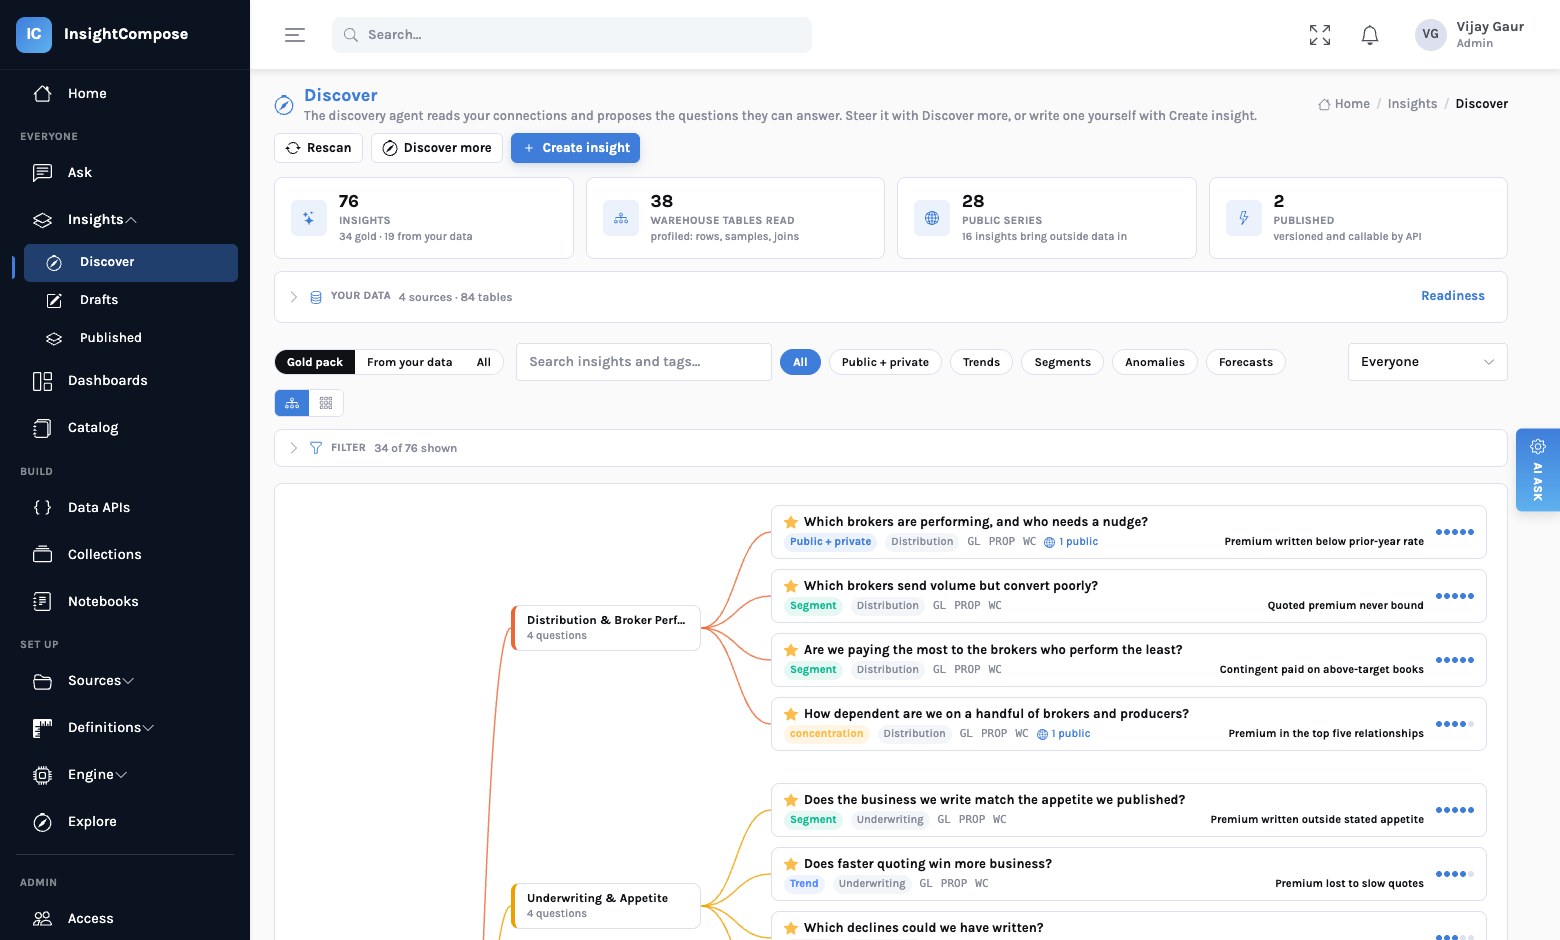
- Discovered, not dreamed up. The agent reads your tables, joins and metrics and proposes questions by theme — distribution, underwriting, claims, concentration. Give it a brief and it proposes more.
- Built from parts. Warehouse queries, outside facts under a column contract, derived steps and a synthesis — planned, run in parallel and narrated. Write the SQL yourself when you already know it.
- Checked without a model. Every figure in the story is matched against the rows the sentence names, the step's totals and shares, and the arithmetic between them. The count is on the page; the misses are listed.
- Drafts, then versions. Build on a proposal into your own draft, run it live, fix it with chat, then publish a version. A publish with untraced figures has to be insisted on, and says so on the record.
- Served, not screenshotted. A published insight answers at any scope — the whole book, one broker, one region — with its claims, drill-through on each one, and a versions list.
How the number stays right
Governed once means: defined once, in one place
A model is good at SQL and bad at knowing what your words mean. InsightCompose does not make it guess on every question. Your business writes the rules once, and the engine is held to them.
- Your glossary, aligned to your schema. Pull the glossaries you already have; the engine matches each term to a column by name, by data and by meaning — and confirms only when name and data agree. "Flagship stores" becomes a filter on a size code, enforced.
- Agreed metrics. Revenue, margin, retention — each with its expression, grain, default filters and the traps it is computed wrong by. Only the definitions a question invokes go into the prompt; a generated query that ignores one is sent back.
- A person keeps the last word. Anything the evidence cannot settle is a hint, not a rule, until a curator confirms it. One-word terms that name several columns are never decided by a machine.
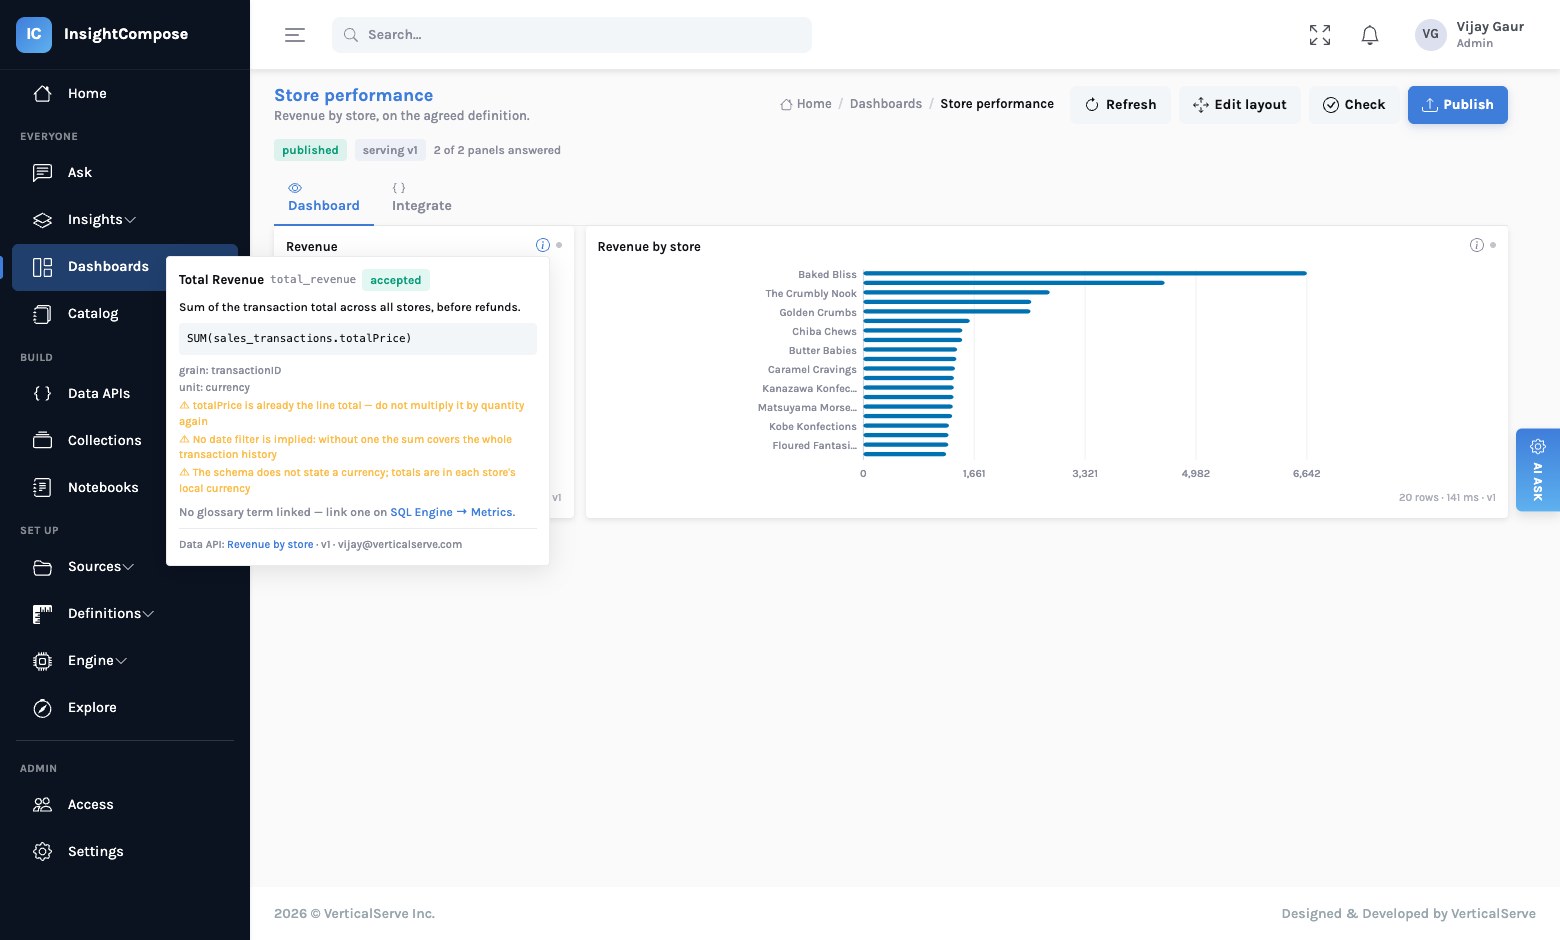
- Every tile can explain itself. The ⓘ on a dashboard tile opens the definition that computed it, the expression and traps, the glossary term it defines and the Data API behind it.
- Suggestions from what is already written down. Joins, standing filters and recurring metrics proposed from the queries people already run and from your dbt project's tests and semantic layer — applied only when a curator accepts them.
- Drift caught before a consumer does. Each re-index checks every data API, insight, metric and dashboard against the schema the warehouse has now, and lists — or posts to Teams or Slack — anything that reads a column that is gone.
- Memory that is bound by the same rules. A repeat question reuses its query — seconds, no model call — and a cached answer is retired the moment a definition it predates is accepted.
Search and resolve
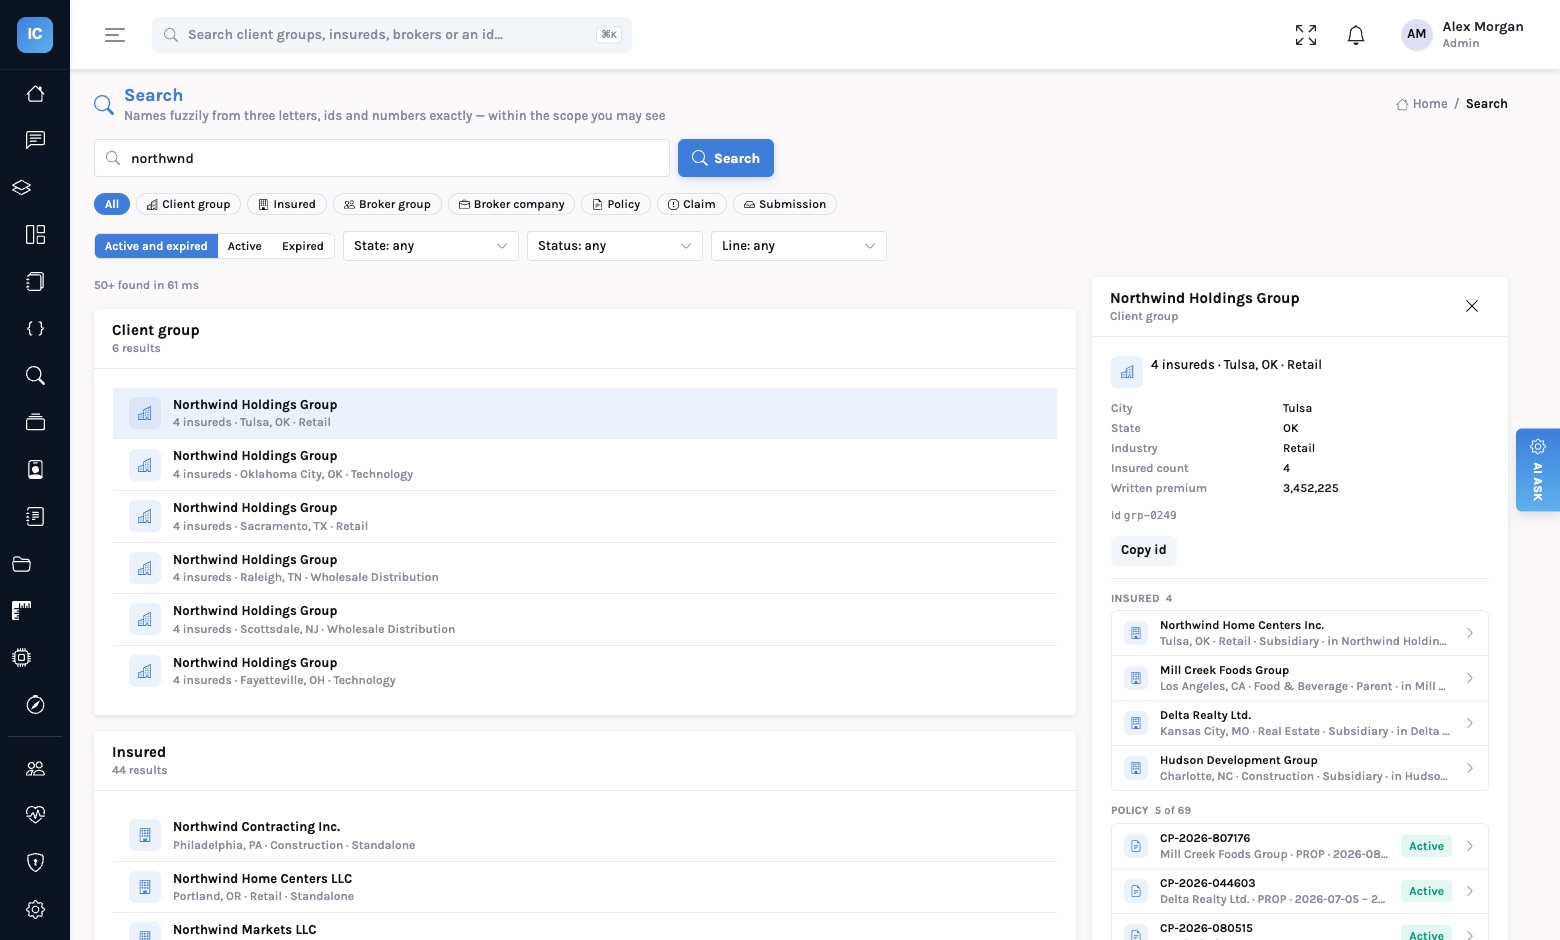
Every name found — even spelt wrong
People look things up by the name they remember and the number on the page in front of them. A LIKE '%…%' misses the misspelling; a model guessing at a client's name writes a query that finds nothing. InsightCompose looks the record up first.
- A search API, not a search box. Names fuzzily from three letters, ids and numbers exactly, active records first, filters by status, line or date, and each hit's related records — in milliseconds, from an index the warehouse fills on a schedule.
- Scoped like everything else. A caller confined to one broker group only finds what that group writes; the scope is part of the index, and it fails closed.
- Resolved before the SQL. Ask finds the client, broker or address a question names and filters on its id. When five records share the name, it asks which one.
- Defined without SQL. Pick a table and the editor drafts the entity — its id, names, parent, active dates and rank — from what indexing already learned. Groups such as a client group are built from their members.
- Nothing reads millions of rows unasked. Entities are detected from metadata; the names behind them are indexed when a curator presses the button.
What you get
Ask, insights, dashboards, data APIs — one catalog
One workspace for the things business teams ask for, on top of the data you already govern — and one place that lists what is published and who calls it.
- Ask. Plain-language questions over the indexed warehouse: the SQL, its checks and the rows it was read from, with follow-ups suggested. A repeat question is answered from memory, with no model call.
- Insights. Discovered or authored, built from parts, verified figure by figure, published as versions and served by API. Fix the story with chat; keep a run as a notebook.
- Dashboards. Describe one in a sentence or upload a Power BI page; watch the panels fill in live as each query is written and proven. Build a chart on shelves with Show me, describe a panel, or drop in an insight. Required parameters for per-customer pages.
- Data APIs. Written in SQL or Jinja, or built visually with the joins worked out; declared, typed parameters; a pinned response shape; breaking changes refused unless declared; column masking; OpenAPI and curl on every one.
- Search. Client groups, customers, brokers, policies and claims found by name from three letters — typos forgiven — or by id exactly, active ones first, related records attached, within each caller's scope.
- Home pages. One call returns a person's whole home — their book, their accounts, their brokers — as verified insight cards, computed overnight. Roles and sections are configuration.
- Collections and notebooks. Versioned sets of insights for a host application to pull in one call; notebooks that snapshot insights, parts and claims and refresh on demand.
- Catalog and governance. Every published object with owner, version, endpoint and usage; a ledger of every call; publish requests and approvals; a definition audit trail; grants per API key or directory group.
Connect any source
Works with the systems you already run
Your warehouse, your identity provider, your language model, your applications — InsightCompose sits between them and adds the governance.
Warehouses and databases
Indexed once, then asked, discovered and queried live. Read-only, row-capped, inside the tables you granted.
- Databricks in production today; PostgreSQL in the engine
- Snowflake, BigQuery, Redshift, Oracle, MySQL through the shared connections layer; the visual builder writes each one's own SQL
- Your glossaries, agreed metrics and dbt project, aligned to the schema
- A drop-in
/api/asksqlfor chatbots built on ask-sql
Identity and entitlement
Sign in the way your company already does, and let its groups decide what people may see.
- Okta, Entra ID and any OpenID Connect provider; group claim to role rules
- Grants per API key or per directory group: which insights, APIs, dashboards and scopes
- Roles: admin, curator, member — and an auditor who reads only
Your applications and agents
Everything published is an endpoint under /api/v1, with OpenAPI, so the next consumer is a fetch call.
- Insights, collections, dashboards and data APIs by slug and version
- Entity search at
/api/v1/searchand a person's home at/api/v1/home - A coding agent can provision data APIs, search indexes and insights through the same API
- Power BI pages rebuilt from a screenshot; layouts drawn by your own components
- Outside facts for insights through a web research provider, under a column contract
Built for
Every team, the same numbers
Each role gets the view and output it needs. Nobody gets a different definition of revenue.
Executive leadership
Decisions on the data, not on the deck
- Insights that lead with what moved and what to do about it
- A Monday pack: a collection of insights at the scope you own
- Every figure traceable to the rows behind it
Analytics teams
Ship an answer once, reuse it everywhere
- Build on what the agent discovered, or write the SQL yourself
- Publish queries, insights and dashboards as versioned endpoints
- Rebuild legacy reports as live dashboards from a screenshot
Business users
Ask in plain English, get answers
- No SQL, no ticket to the data team
- Find any client, broker or policy by name — typos forgiven
- Ask a follow-up; the suggestions are written from your data
- Request a publish when something is worth sharing; a curator approves
Data & IT
Governed, audited, in your environment
- Readiness scores and next steps per source; definitions a curator accepts
- Grants, masking, quotas, a ledger of every call and an audit trail of every definition change
- Deploys in your cloud accounts or on-prem
Security & deployment
Your data never leaves your environment
Deploy on-premise or in your private cloud. Processing runs inside your perimeter, and the language model is your account's own endpoint — Bedrock, Vertex, Azure OpenAI or a model you host.
On-premise or private cloud
Runs in your AWS, GCP or Azure accounts, or your own data centre, behind your IAM — one Docker Compose stack, or an offline archive with no registry in the middle. No data leaves the account; the only outside call is to the model endpoint you choose.
Bring your own stack
Your choice of LLM, vector store, catalog and observability. InsightCompose is the glue, not the lock-in.
Governed by default
Read-only, row-capped SQL inside the tables you granted. Column masking per data API. Grants per key or directory group, daily quotas, and a ledger of every call with who asked, what ran and what was refused.
Built for regulated programs
Publish requests and approvals, an audit trail of every definition change with its author, and roles that keep writes with curators — designed to support GDPR, HIPAA, SOC 2 and CCPA obligations. Ask us for the current security documentation.
From the blog
How we think about this
Written for the people who have to decide, fund and integrate it.