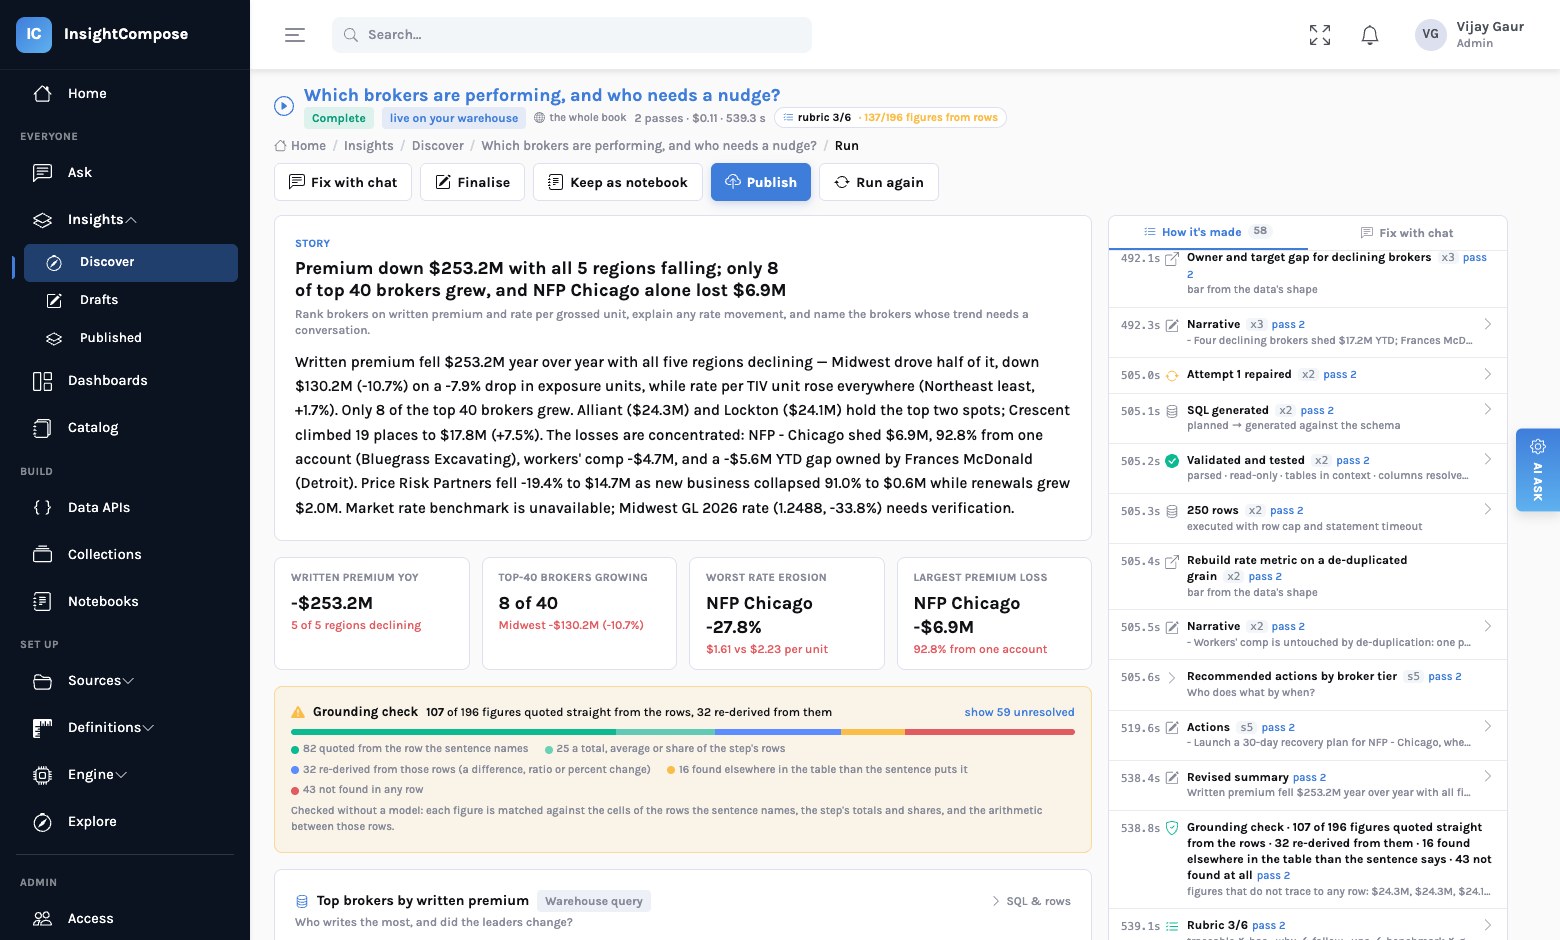
A chart is not an insight. "Written premium by region, 2025" is a chart. "Premium fell $253M with all five regions down, Midwest drove half of it on a 7.9% drop in exposure, only eight of the top forty brokers grew, and NFP Chicago's loss is one account" is an insight — and it is only worth anything if each of those figures can be pointed at a row. This is how InsightCompose produces the second kind, and how it refuses to pretend when it cannot.
Where the questions come from
Most analytics tools wait for a question. InsightCompose starts by reading the warehouse it has been given: the tables, their joins, the measures that recur, the glossary terms and agreed metrics a curator has accepted. From that it proposes questions, grouped by theme — distribution and broker performance, underwriting and appetite, claims, concentration — each with the parts it would take to answer and a first guess at what the data would show. That is the Discover page: a catalogue of what your data can say, before anyone has asked it anything.
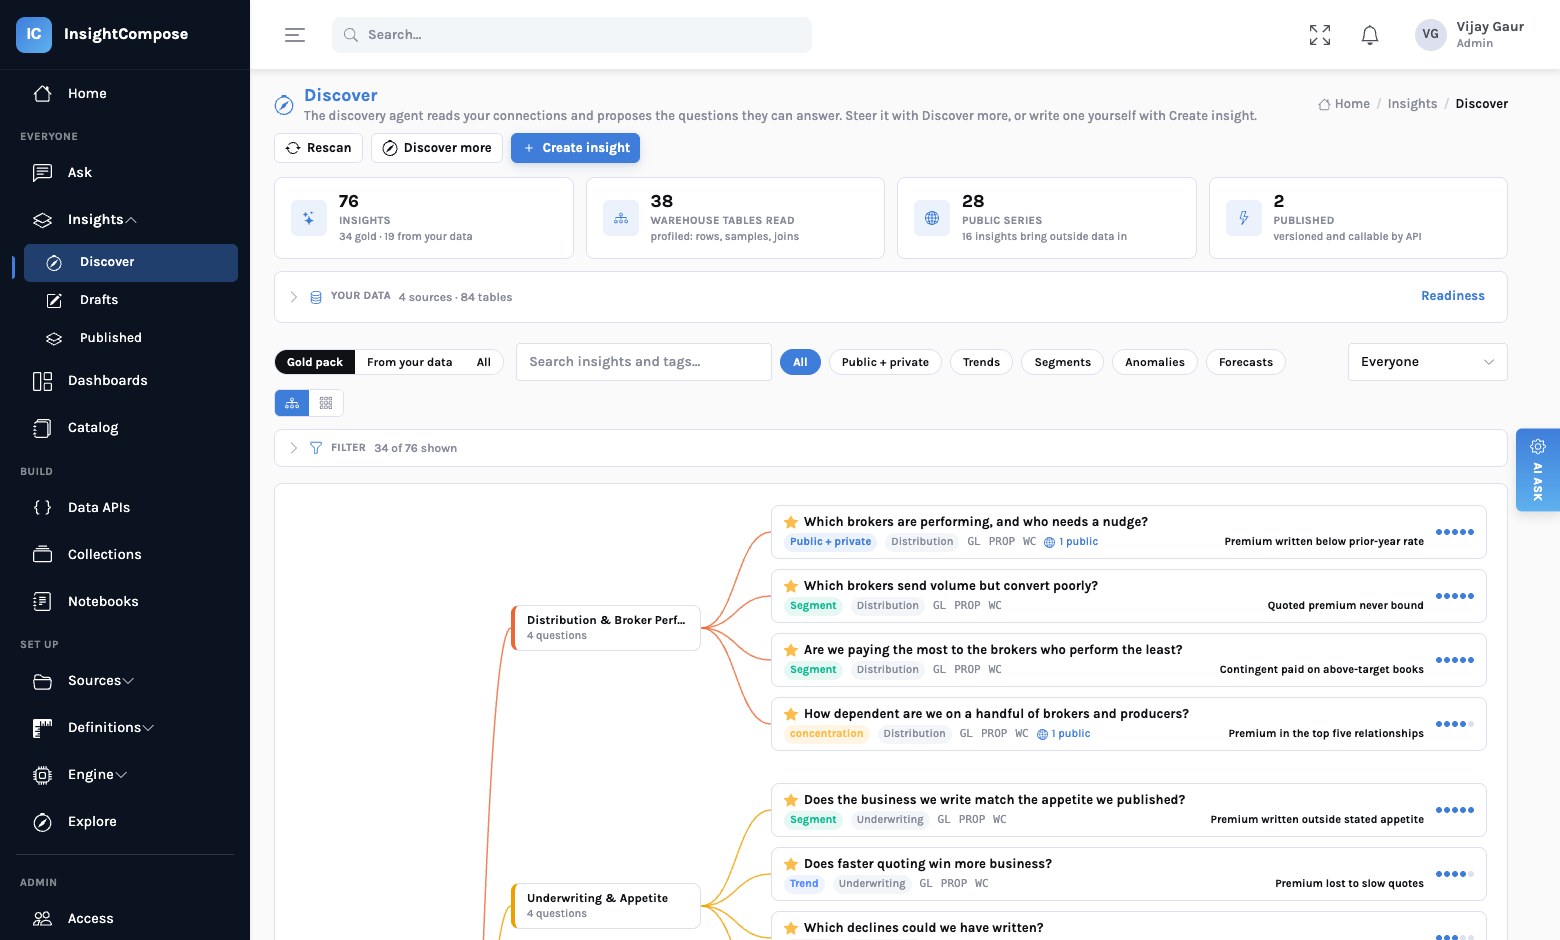
Two things keep this from being a wall of noise. The catalogue is read-only: proposals are never edited in place, so a rescan after the schema changes replaces untouched proposals and leaves alone anything a person has built on, run or published. And it can be steered: tell it in a paragraph what you care about — "broker profitability for the Midwest, with commission in it" — and it proposes a theme of complex insights for that, each one already planned into parts.
An insight is built from parts
An insight is not one query. It is a small plan of parts that feed each other, and the plan is the thing a person edits.
| Part | What it does | What holds it honest |
|---|---|---|
| Warehouse query | A question the SQL engine answers against your tables, using your definitions and vocabulary. | Validated, read-only, row-capped; the SQL and its checks are kept with the result. |
| Outside facts | A public figure the story needs — a market rate, a benchmark — fetched through a research provider. | Asked under a column contract; cached by question; a refusal is cached briefly and never silently filled in. |
| Derived | Arithmetic over earlier parts: a share, a difference, a ratio. | Runs locally over the rows already fetched; never reaches the warehouse. |
| Synthesis | What it adds up to, and what should be done about it. | Written last, from the parts above, then critiqued and verified. |
Parts that do not depend on each other run in parallel. You watch the run fill in step by step — the SQL generated, validated and executed; the rows; the chart chosen from the data's shape; the narrative for each part; the draft summary; the critique; the actions — and the trace stays with the run afterwards. If you already know the SQL, Write the query myself makes one query part plus a synthesis and runs it straight away.
Checked without a model
Here is the part we would defend hardest. When the story is written, every figure in it is matched against the data — not by asking a model whether it looks right, but mechanically: against the cells of the rows the sentence names, against the step's totals and shares, and against the arithmetic between those rows (a difference, a ratio, a percent change). The result is a count on the page and a list of what did not trace.
flowchart LR
  F["A figure in the story
-$253.2M"] --> Q{"Quoted from the row
the sentence names?"}
  Q -->|yes| G["Grounded"]
  Q -->|no| T{"A total, average
or share of the step's rows?"}
  T -->|yes| G
  T -->|no| D{"Re-derived from those rows?
difference · ratio · % change"}
  D -->|yes| G
  D -->|no| E{"Found elsewhere
in the table?"}
  E -->|yes| W["Misplaced — flagged"]
  E -->|no| U["Not found — listed"]
  style G fill:#e6f7f2,stroke:#9fd8c9
  style W fill:#fdf6ec,stroke:#e6c79c
  style U fill:#fdecec,stroke:#e8a0a0
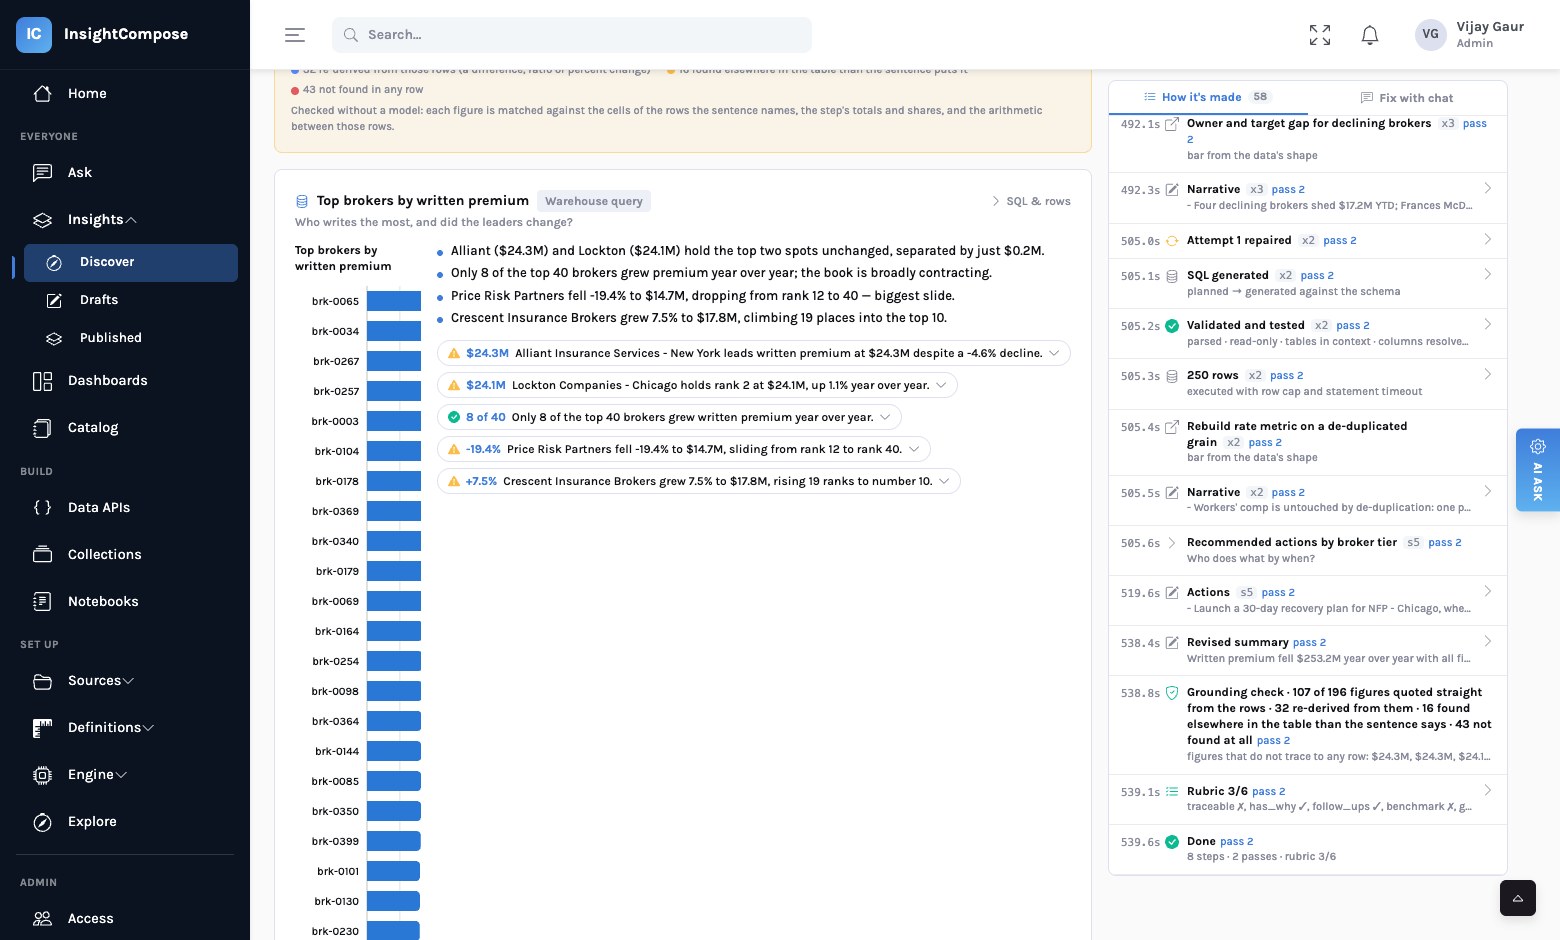
A second pass critiques the draft against a short rubric — traceable, has a why, follow-ups, a benchmark, the right grain, actionable — and the run's score is shown next to its title. A story can be fixed in chat ("lead with the biggest mover"), and the fix is re-verified: the claims keep their figures, the grounding is recomputed, nothing is invented in the edit.
Drafts, then versions
There are two populations of insight, and the line between them matters for governance. The catalogue is what the agent proposed; it is never edited. The library is what people own: Build on this copies a proposal into your draft; drafts are run, edited in a builder (one part at a time, with a "test this part as edited" button), and eventually published as version 1. Publishing again makes version 2; earlier versions keep serving until someone moves.
What publishing refuses
A run whose figures do not all trace to rows is not published on a click. The refusal lists the figures. A person can insist — Publish anyway — and the version records that untraced figures were accepted and by whom. A run with no completed result cannot be published at all, and neither can a catalogue proposal.
Members do not publish; they request a publish, and a curator or admin approves it from the catalog, with the same checks. That is deliberate: the person who built the story and the person who decides it may carry the company's name are usually different people.
Served, not screenshotted
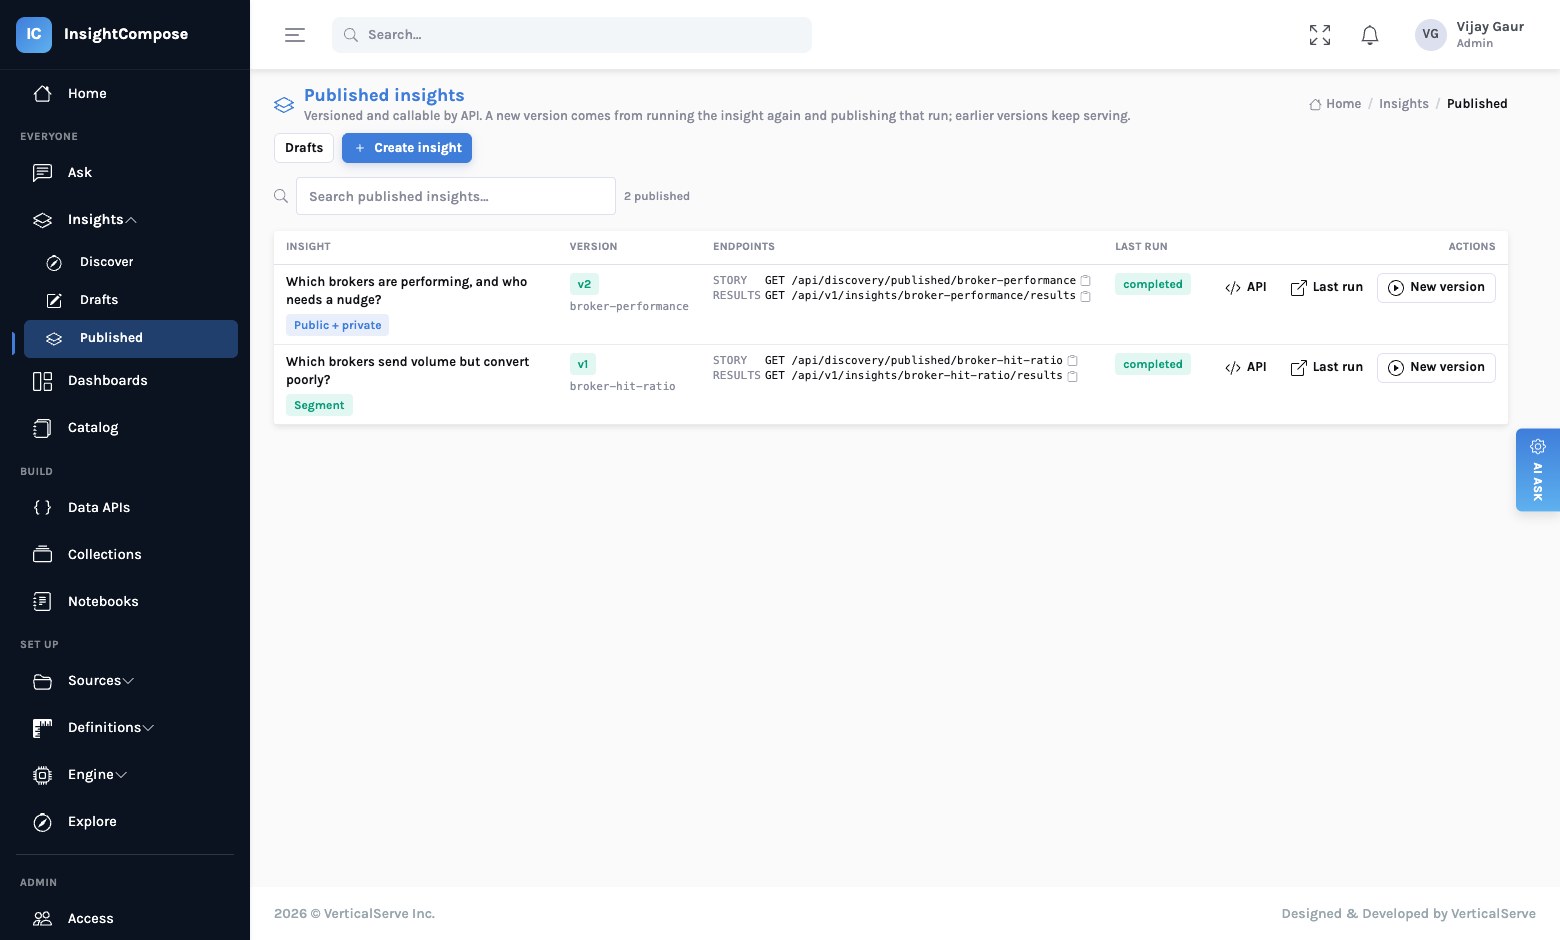
A published insight is an endpoint. GET /api/v1/insights/broker-performance describes it;
POST /api/v1/insights/broker-performance/results with a scope — the whole book, one
broker, one region — returns the story, its tiles, its sections with rows and chart, its claims and
its grounding. Each claim can be drilled into and asked about. There is an OpenAPI document per insight,
and a versions list, so a consumer can pin.
Three things sit on top of that contract:
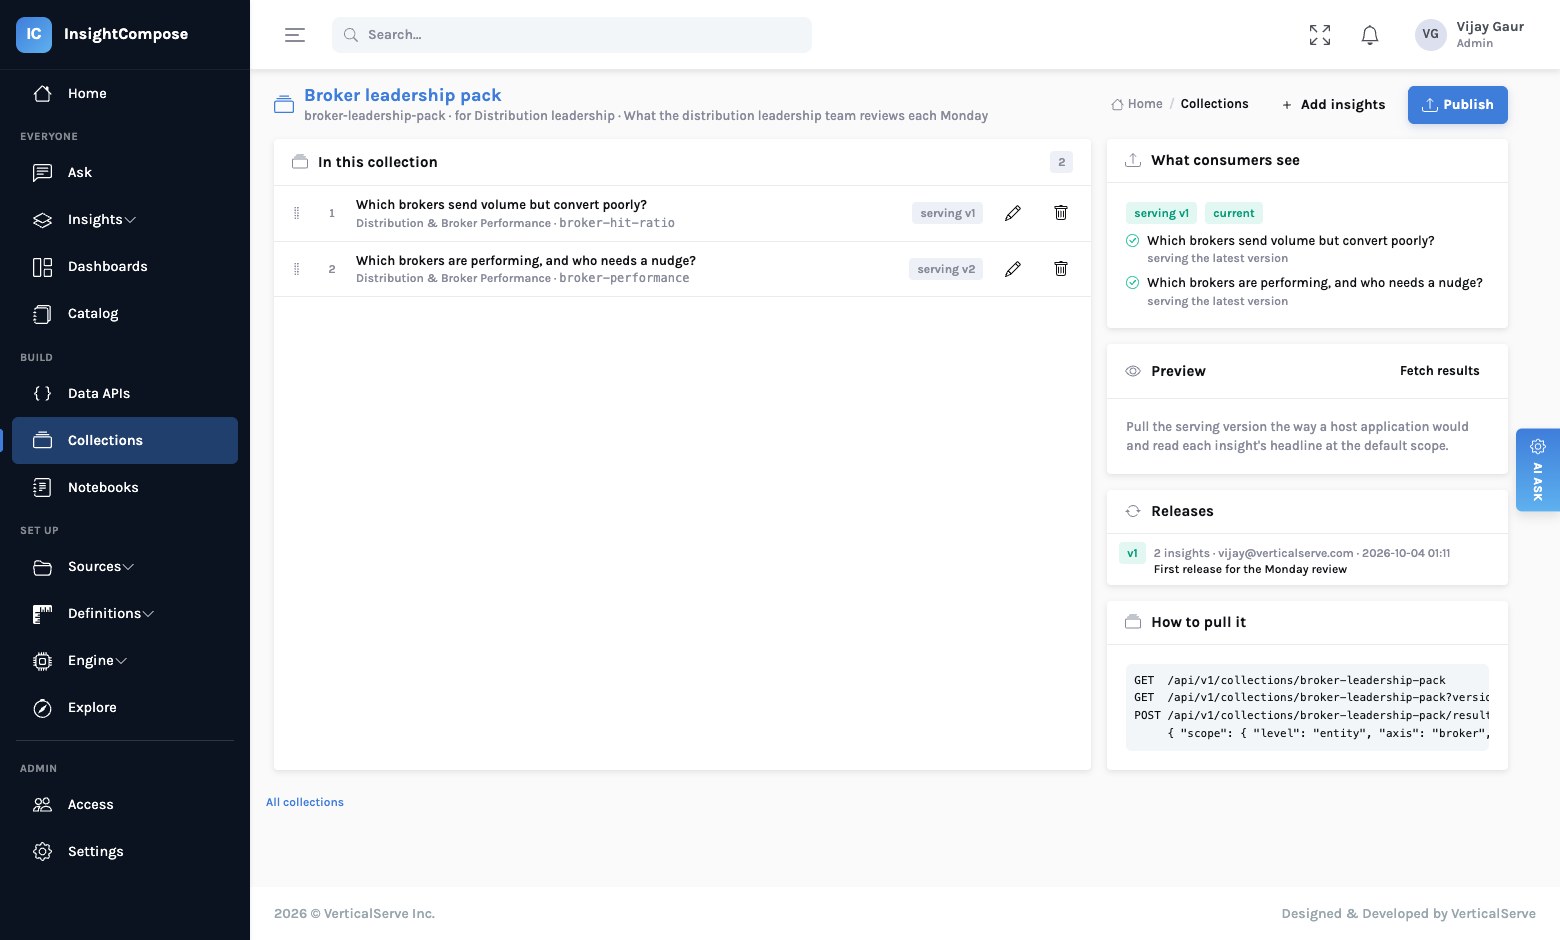
- Collections. An ordered set of insights — a Monday pack, a broker review — published as its own version and pulled in one call at one scope. A collection's health page says whether each member is still serving its latest version.
- Notebooks. A document over insights: a cell is an insight, a part or a single claim with a snapshot of what it showed; Refresh re-takes the snapshot through the same API a host application would use. No SQL runs in a notebook, so nothing in one can drift from what was verified.
- Dashboards. A panel can be an insight part, with its narrative underneath and a link back to the insight — the same figures, served the same way.
What it does not do
It does not make a model the arbiter of truth; the verifier is deterministic and the model's job is to author. It does not fill a gap in your data with a plausible number; a part that cannot be answered says so and the story works around it. It does not publish a catalogue proposal as if a person had vouched for it. And it does not yet re-parse the SQL to prove an agreed metric's formula was used verbatim — the run records that the definition was offered and the verifier checks the figures, which is as far as we will claim.
The principle
An insight is an argument, and an argument is only as good as its evidence. Generate freely; verify mechanically; publish deliberately; serve by version.
Read next
Describe a dashboard. Watch it build. — the same engine writing one data API per panel, live, from a sentence. And A catalog with a ledger — who may call what you published, and who approved it.