"Claims operations for the head of claims: open claim count, total incurred and average incurred per claim as cards for the accounting year; open claims by line of business as columns; incurred by loss state as bars; claims reported by month as a line; a table of the twenty oldest open claims. Filters: accounting year, line of business (multi), claim status." That paragraph is the whole specification. About a minute later it is a dashboard with ten live panels, and this is what happened in between.
Plan first, then write every query at once
A planner turns the description into a layout: which panels, what kind each one is (card, column, bar, line, donut, table), what each is asked to show in one sentence — its brief — and which filters the page carries. That plan is cheap and arrives in seconds, so the dashboard appears immediately as a skeleton: every panel in its place, each showing the brief it was given and Writing the query…
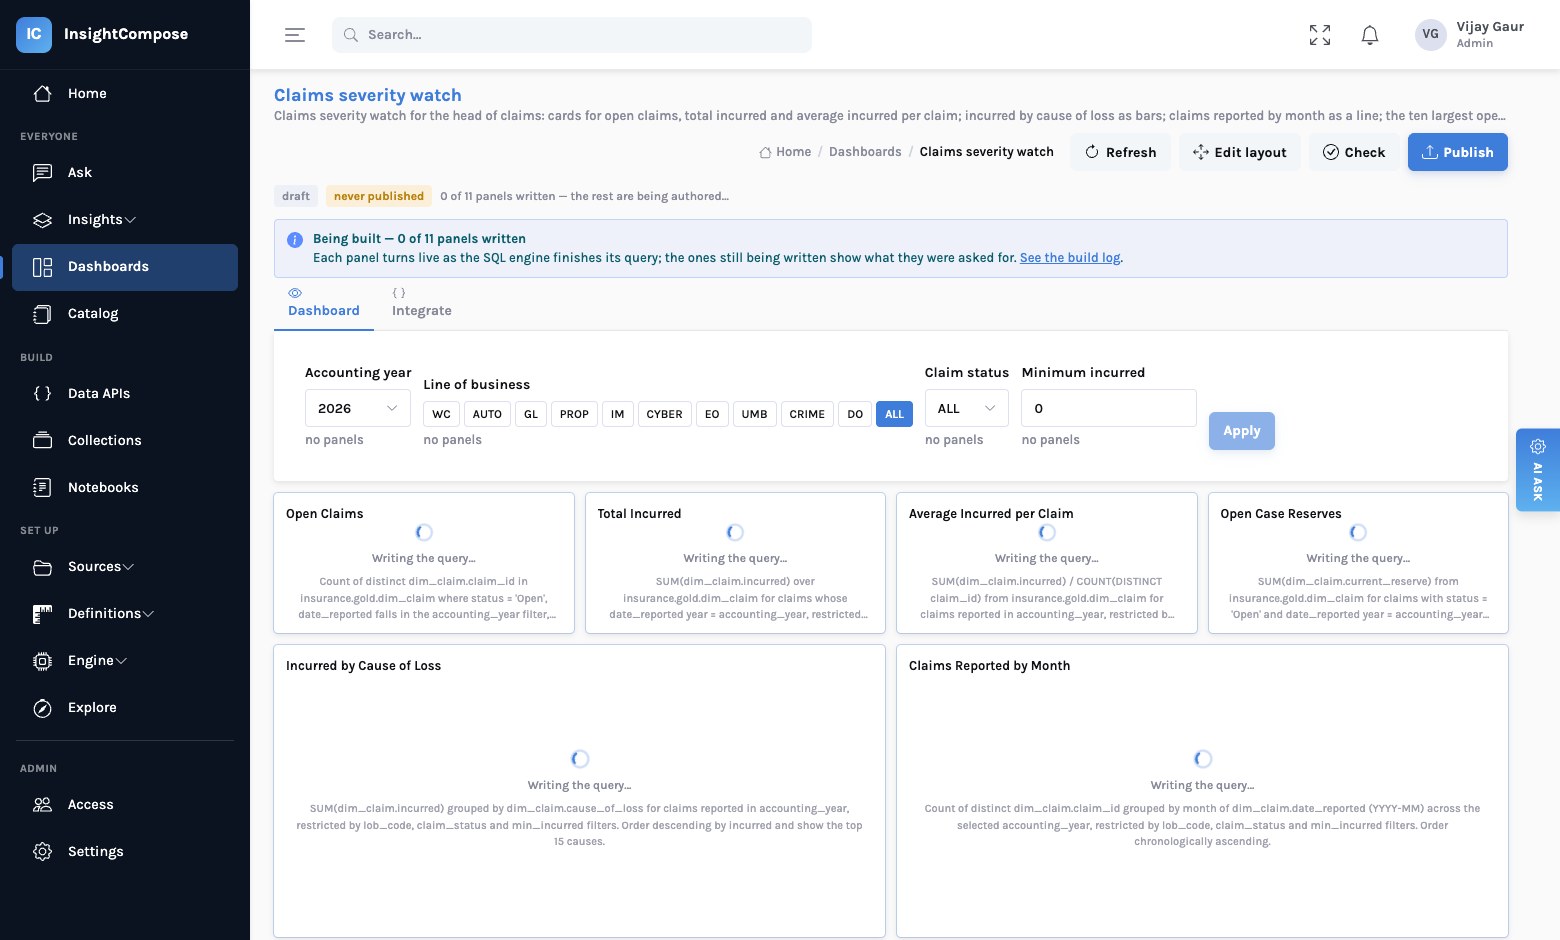
Then one author per panel runs in parallel. Each is given its brief, the page's filters and the indexed schema,
and asks the same SQL engine that answers questions in Ask — so your agreed metrics and
vocabulary apply here too. The engine answers with the filters' defaults as literals; the author then lifts
those literals into declared parameters (:accounting_year, :lob_code), and
proves the lift by running both versions and comparing their first fifty rows. A panel whose
parameterised query does not return what the literal one did is retried, and if it still cannot be made
honest it is reported, not landed.
sequenceDiagram
  autonumber
  participant U as You
  participant P as Planner
  participant A as One author per panel
  participant E as SQL engine
  participant W as Warehouse
  U->>P: A paragraph describing the page
  P-->>U: Skeleton dashboard: panels, briefs, filter bar
  par in parallel, one per panel
    A->>E: Brief + filters + schema
    E->>W: Candidate SQL, defaults as literals
    A->>A: Lift literals into :parameters
    A->>W: Run both; first 50 rows must match
    A-->>U: Panel turns live (or says why not)
  end
  P-->>U: Filters trimmed to the panels that use them; build report
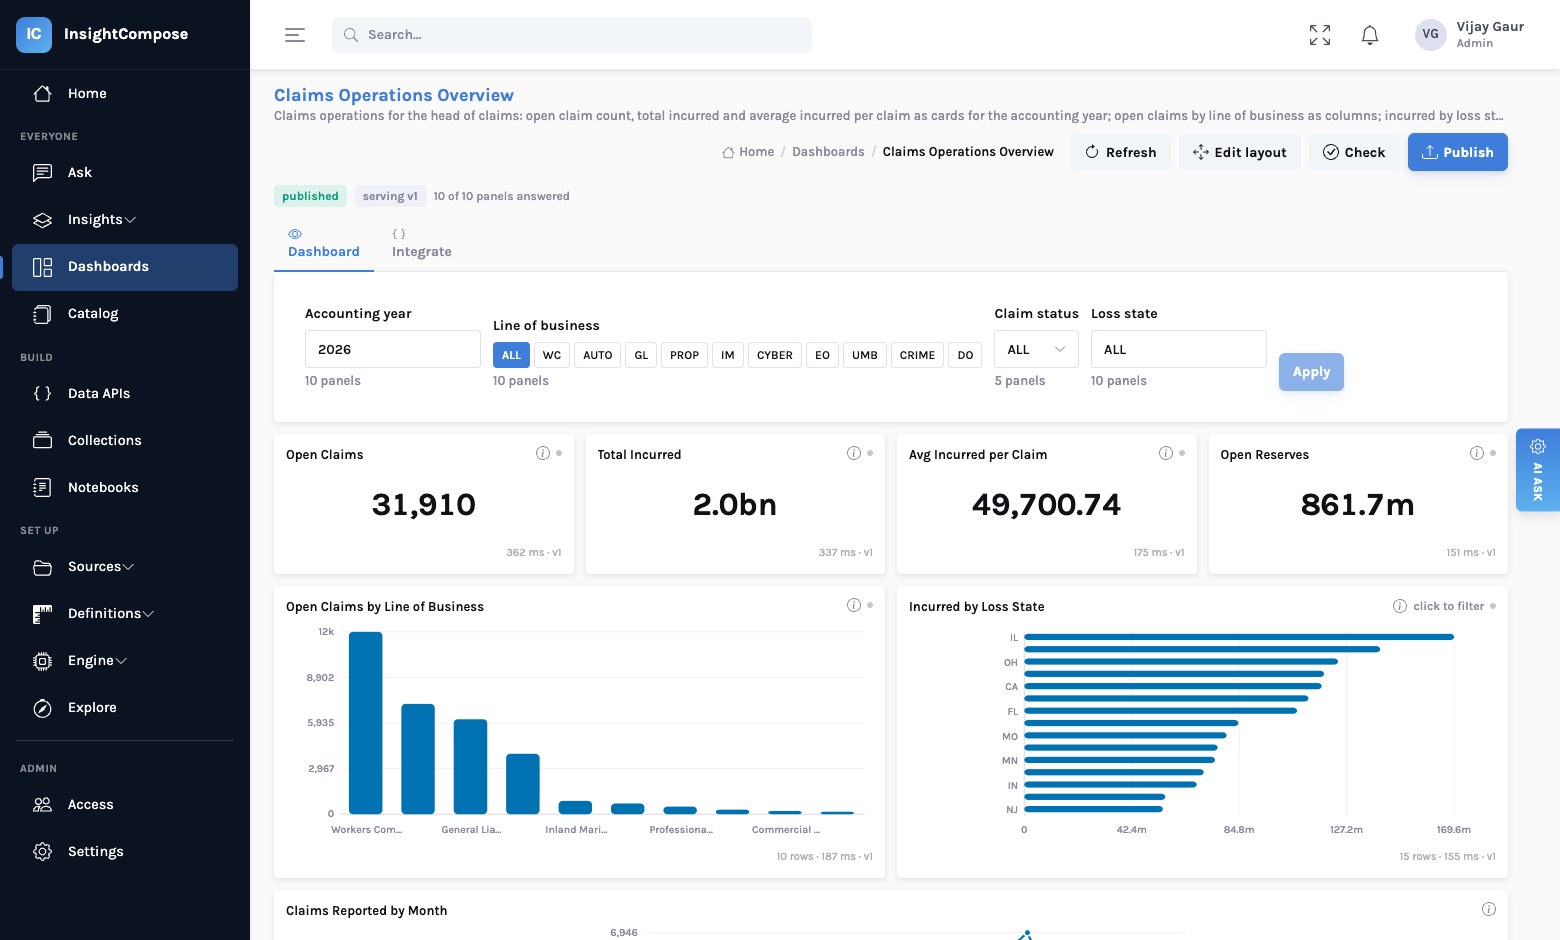
Every landed query is checked and published as a data API with its parameters declared and its columns pinned. The dashboard is just their first consumer. When the last author finishes, the filter bar is trimmed to the controls that actually reach a panel, and the build report says what each panel became and why.
Changing it without starting over
A described dashboard is an ordinary dashboard afterwards. In Edit layout you drag and resize; the inspector on a panel lets you change the chart kind (a donut to a bar to a table), the title and the encodings without touching the query. Three ways to change the data behind a panel:
| You want to | You do | What happens |
|---|---|---|
| Change what a panel shows | Rewrite from description — edit the panel's brief | The author writes and proves a new query and publishes it as the next version of that panel's data API. |
| Take over the SQL | Edit the SQL instead | Opens the data API behind the panel; a breaking change to its columns is refused unless declared. |
| Add a panel | Describe a panel, or From an insight | A new panel with its own data API, cross-filterable like the rest — or an insight part with its narrative underneath and a link to the insight. |
A dashboard that takes a parameter
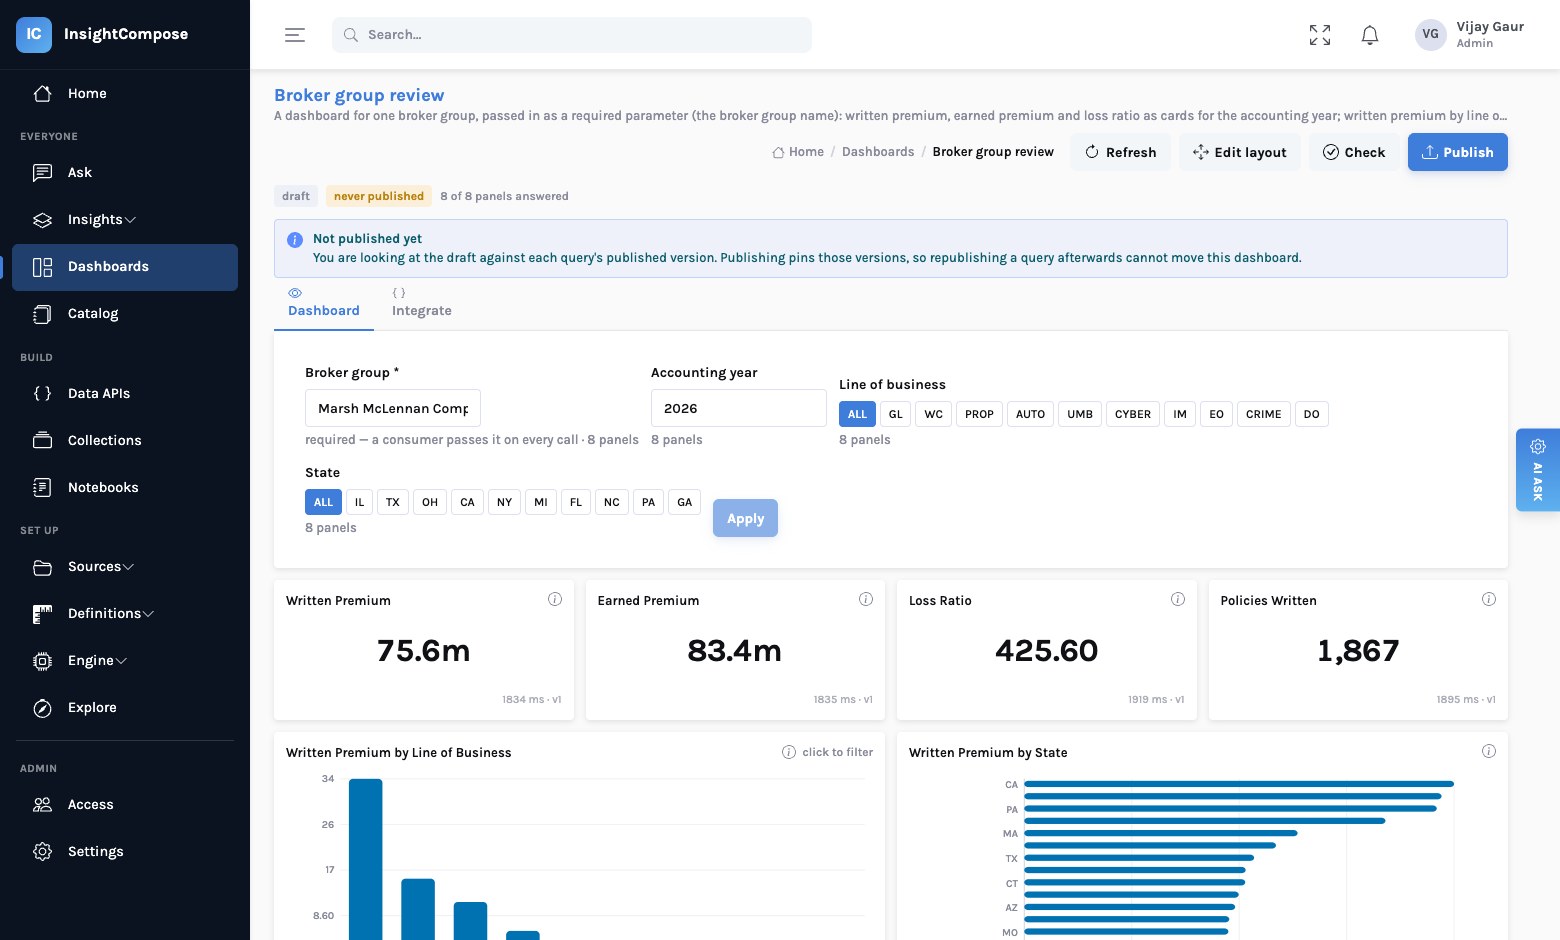
The question we were asked most: "we need this page per broker group — pass the group in, keep the region and line filters." That is a required parameter: a filter with no default and an example, which a consumer must send on every call. Describe it that way and every panel's author is held to it — a panel that does not use the parameter is refused, because a per-customer page with one panel showing everyone's numbers is a leak, not a dashboard.
Publish, check, integrate
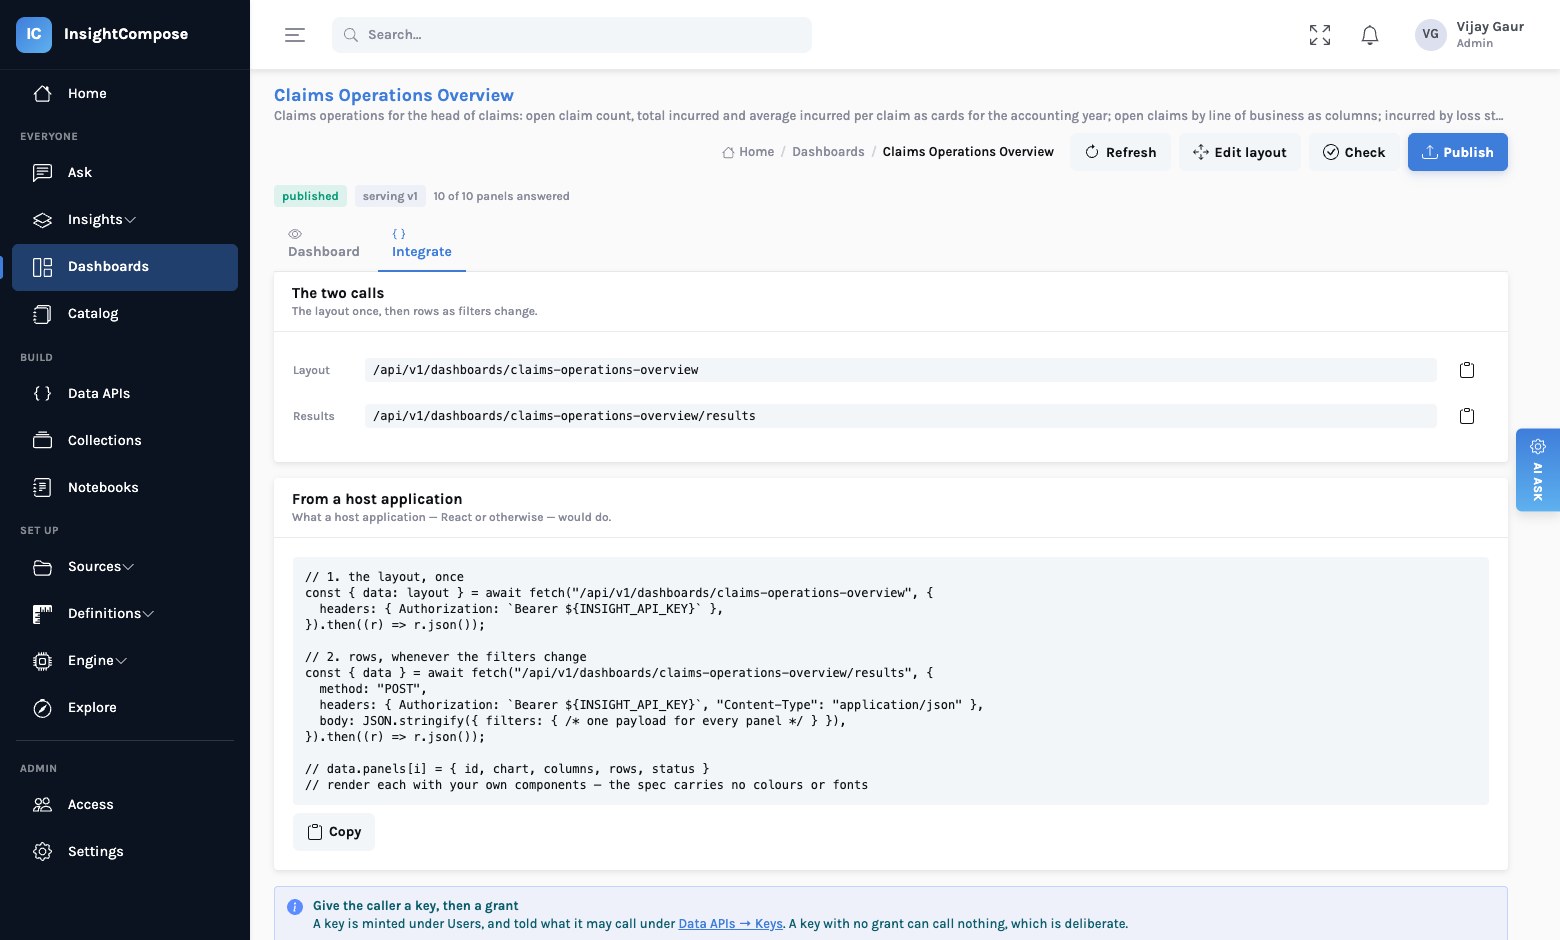
Check refuses a publish for the reasons a reviewer would: a panel sitting on a data API that is still a draft, a filter that no panel uses, a required parameter nobody wired. Publish pins the data API versions behind each panel, so republishing a query later does not move a dashboard other teams depend on. Integrate shows a host application the two calls it makes: the layout once, then rows as filters change — and your own components do the drawing.
And the picture route still works
Upload a Power BI page instead of writing a paragraph and the same machinery runs, with a vision pass in front of the planner that reads the visuals, their kinds, titles and labels — and refuses to infer a measure definition that is not printed on the image. We wrote that up in From a Power BI screenshot to a live dashboard; the live skeleton and the per-panel verifier described here apply to both routes.
The principle
A dashboard is a sentence about what a team needs to watch. Let the sentence be the specification, let the engine prove every panel against the rows, and keep each panel addressable so the page is never the only place the number lives.
Read next
Embedding insight in the apps people already use — what the layout contains and how your application draws it. A catalog with a ledger — who may call the panels you just published.